


How to Maximize Customer Value with RFM Analysis?
Step-by-step guide to enhancing customer insights and increasing revenue.

Unlocking additional revenue per customer is not always an easy task, especially if you’ve exhausted all your options and budgets.
However, there is an analysis I discovered a few years back that, through scoring, identifies valuable user segments you can target to create more value: RFM analysis.
To be honest, in my career, I’ve seen very few teams utilising the power of RFM analysis.
In this article, I will provide a 101 guide about:
• What is RFM Analysis?
• Why is it important to invest time and effort into RFM Analysis?
• How to start implementing and get results?
What is RFM Analysis?
RFM is a data-driven method used for analyzing customer value. Such an analysis helps businesses categorize customers into segments, enabling targeted and personalized strategies.
The main aim is to understand and categorize customers based on their recent purchases, transaction frequency, and overall spending.
The most common domain for RFM analysis is within marketing.
RFM Components
The way to measure is with the so-called “3 dimensions”:
R = Recency
F = Frequency
M = Monetary Value
Let’s quickly look at each of them.
Recency
The basic question this module answers is: “How recently did the customer purchase?”
Usually, the activity is a “purchase,” but in some rare cases, companies use “last visit to a website” or “use of a mobile app.”
Frequency
This module answers: “How often do they purchase?”
Customers who engage in frequent activities tend to be more engaged and likely more loyal compared to those who are infrequent users. Meanwhile, customers who make a single purchase are in a unique category by themselves.
Monetary Value
The last module answers: “How much do they spend?”
Assessing the average purchase amount, calculated by dividing the total monetary value by purchase frequency, is a crucial secondary metric for effective customer segmentation.
Why is RFM Analysis Beneficial?
In this section, we will explain what is special about RFM analysis, encouraging you to consider it and maybe start working on it.
There are many benefits to using RFM analysis. Let’s focus on the key ones based on my experience and observations.
1. Awesome Segmentation Method
RFM analysis is one of the cleanest and most powerful ways to segment your customers. By evaluating how recently customers made a purchase (Recency), how often they purchase (Frequency), and how much they spend (Monetary), you can create highly targeted segments. This precision allows you to tailor your marketing efforts more effectively than traditional demographic or geographic segmentation.
Overall, this method is also quite simple, without the need for data scientists or sophisticated software.
2. Strong Focus and Impact on Revenue
RFM analysis directly correlates with revenue generation. By focusing on the most valuable customers - those who buy often and spend the most - you can optimize your marketing resources for maximum return (ROI). This focus ensures that your efforts are driving significant financial impact.
3. Improving Customer Retention and Loyalty
By understanding which customers are at risk of churning (low recency) or which are the most loyal (high frequency and monetary value), companies can tailor their retention strategies and loyalty programs more effectively.
4. Predict Future Buying Behavior
RFM analysis helps in forecasting future customer behavior. By analyzing past purchasing patterns in terms of recency, frequency, and monetary value, businesses can predict which customers are likely to make purchases in the near future, what they might buy, and how much they might spend. This predictive capability allows for proactive marketing and inventory management.
5. Enhancing Revenue Forecasting
RFM data provides valuable insights into customer purchasing patterns, allowing for more accurate revenue predictions and helping businesses make informed decisions about inventory, staffing, and marketing investments.
6. Early Warning System for Customer Churn
The recency component of RFM analysis serves as an early warning system for potential customer churn, allowing businesses to proactively engage with at-risk customers before they leave.
How to Start with RFM Analysis?
In this final chapter, I will create an easy-to-follow guide on:
How to set up your RFM analysis?
How to read it and collect insights?
How to set up action points?
The main goal is to improve revenue from the existing list by segmenting users to create more targeted campaigns. Let’s dive in.
How to Set Up Your RFM Analysis?
Step 1: Collect the Necessary Data
As mentioned above, the foundational elements are historical data on:
• Customer transactions
• Customer ID
• Monetary value (or order amount)
Most of the time, you can obtain this from your CRM, ERP system, or your transactional database.
Step 2: Prepare the Data for Analysis
Having collected the data, it’s time to prepare it so we can easily calculate each of the values. The easiest way to start is by using either Excel or Google Sheets.
We start with this.
In order to calculate the recency, we need to add another column which can called “Days Since Transaction”, which will help us find the latest transaction date for each customer.
It looks something like this:
Here we calculate the last column using the formula =Today() - B2Since our database includes multiple transactions per customer, it is crucial to identify the most recent transaction date for each customer when calculating Recency.
We can do this by using a Pivot Table.
This approach allows us to create a smaller dataset that includes only the most recent transaction date for each customer.
Step 3: Divide Customers into Tiers
This step can be done even at the beginning; there’s no specific order. Essentially, we need to divide the customer list into tiered groups for each of the three dimensions (R, F, and M).
It is usually recommended (though not mandatory) to divide customers into 3 tiers per dimension. In our case, we are talking about 27 distinct customer segments (3 x 3 x 3). Some use 4 tiers (4 x 4 x 4), resulting in 64 segments. It’s often easier to calculate and more granular without exceeding 3 tiers.
Here is an example of a 3-tier structure I’ve created.
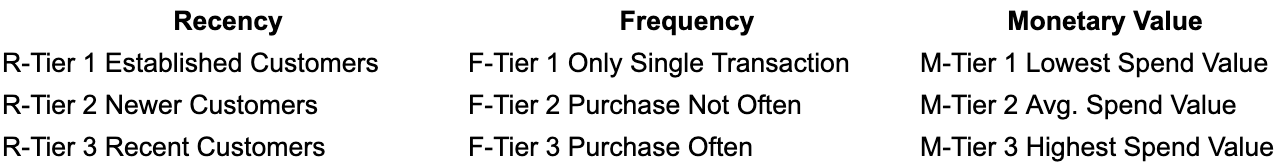
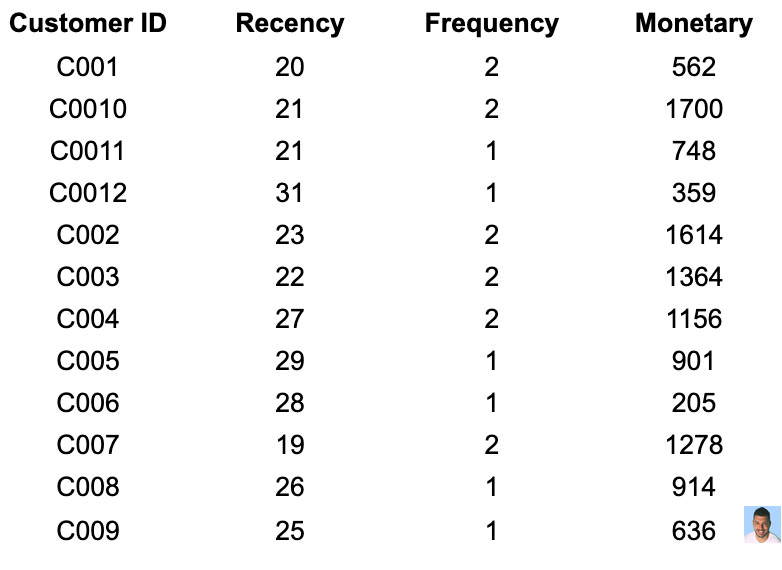
Step 4: Assign Recency, Frequency & Monetary Values to Our Analysis
The next step is to take the previous Google Sheet, rename the columns, and add the corresponding values
“Days Since Transactions” > “Recency”
“Order Value” > “Monetary”
“Customer ID”> “Frequency”
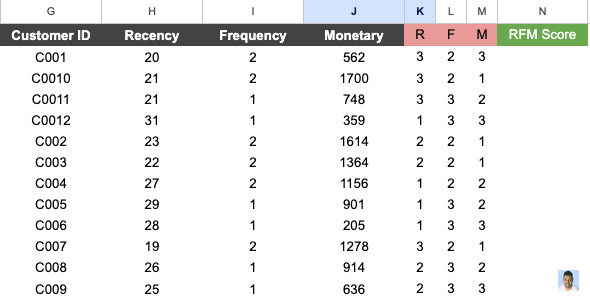
Step 5: Calculate RFM Score
As a final step, we need to calculate the overall RFM score.
Recency
To begin, we need to determine the duration for which 33% and 66% of our customers have made purchases. This can be quickly accomplished by using the following formula:
=PERCENTILE.INC([range], 0.33) and =PERCENTILE.INC([range], 0.66).Where inside the [range] we add the “recency” column from above.
The numbers show that 33% of customers bought our product 21.63 days ago, and 66% of our customers bought it less than 26.26 days ago.
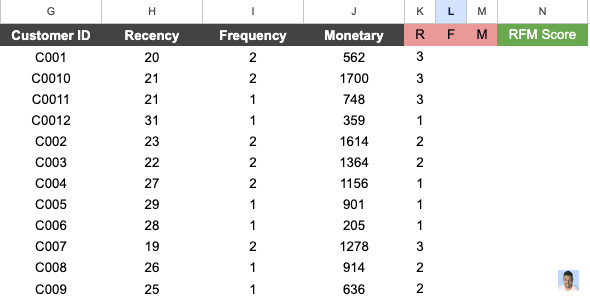
The next step is to assign the Recency value according to the two values above:
Value 3 for those who bought less than 21.63 days ago.
Value 2 for those who placed an order between 21.63 and 26.26 days ago.
Value 1 for those who bought more than 26.26 days ago.
The formula I use is =if(H2<21.63,3,IF(H2 <26.26, 2, 1))This is final outcome for the Recency.
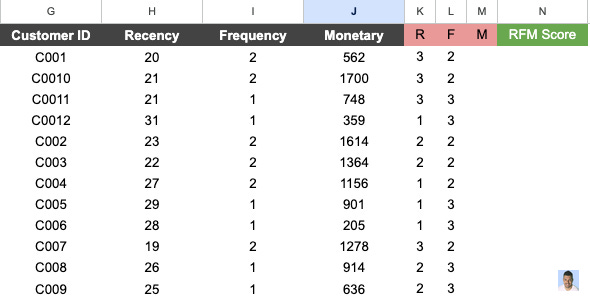
Frequency
For frequency, we follow the same approach as recency and calculate how many times 33% and 66% of our customers made a purchase. The value assignment is the same as well.
Since my dataset is small, the frequency value is also small.
The numbers show that 33% of customers bought our product 1 time, and 66% of our customers bought it 2 times.
Monetary Value
For frequency, we follow the same approach as recency and calculate how many times 33% and 66% of our customers made a purchase. The value assignment is the same as well.
The numbers show that 33% of customers bought items for $706.56, and 66% bought items for $1187.72.
RFM Score
Now we have all three components to calculate the RFM score.
The formula we can use is:
RFM = R * 100 + F * 10 + M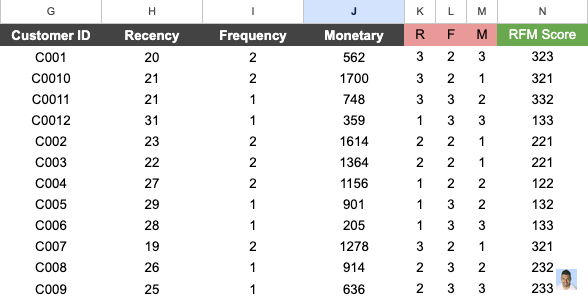
Here we have it, a complete RFM Score across our customers. In the next section, I will explain how you can read this data.
How to Read Your RFM Analysis?
The easiest way to start is to sort it from the highest to the lowest. In our case, the data is going to look like this.
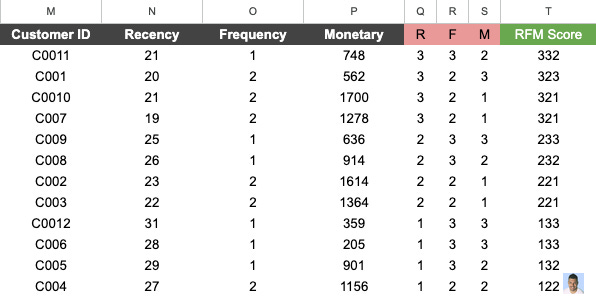
From the RFM table, we can observe several key insights:
1. High-Value Customers
Customers C0011, C001, and C0010 have the highest RFM scores (332, 323, 321). These customers purchase the most frequently, spend more on average, and have recently made purchases.
2. At-Risk Customers
Customers C004, C005, and C006 have the lowest RFM scores (122, 132, 133). These customers have not purchased recently and spend less on average (exceptions always occur).
3. Potential Loyal Customers
Customers C008, C002, and C003 have decent RFM scores (232, 221, 211) due to average purchase frequency and good monetary value.
In the final step of the RFM analysis guide, we will discuss what you can do next with such data.
What Action Points Can You Take from Your RFM Analysis?
Every team has its own strategy tailored to its unique business model and targets.
That’s why I will give a few ideas on what you can do with your RFM users based on the analysis ( Some of them I’ve personally worked on, others I’ve observed ).
1. Implement a Tiered Loyalty Program
You want at all costs to keep the users with the highest scores and incentivise their trust in your brand. But you should not stop there, because a tiered loyalty program can be highly effective in maintaining and improving customer engagement across all segments.
Example: Create three tiers: Bronze, Silver, and Gold, and incentivise based on tier level and amount spent.
Bronze - 1% cashback
Silver - 3% cashback
Gold - 5% cashback
2. Personalized Re-engagement Campaigns
For at-risk customers with low RFM scores, create highly personalized re-engagement campaigns to win them back and increase their engagement. You want them to start feeling special.
Example: Segment at-risk customers based on their last purchase category or highest-value historical purchase. Create a three-part email campaign for each segment.
3. Segment-Specific Product Development
Ensure your product offerings resonate with different customer segments, especially your high-value customers. By involving them in the development process, you can create products that meet their needs while increasing their engagement with your brand.
Example: Create an exclusive “Product Innovation Panel” for your top RFM scorers:
Bronze: Quarterly surveys about product preferences
Silver: Monthly online focus groups for feedback on product concepts
Gold: VIP prototype testing with personalized feedback sessions
4. Dynamic Pricing and Promotion Engine
Implementing a dynamic pricing strategy based on RFM scores can encourage desired customer behaviors while providing personalized value. This approach can help retain high-value customers and motivate others to increase their engagement.
Example: Offer automatic discounts on the next purchase based on customer RFM scores.
Bronze: 5% off next purchase
Silver: 10% off next purchase
Gold: 15% off next purchase, plus free shipping
5. RFM-Driven Customer Success Program
A proactive customer success strategy using RFM scores can help predict and prevent churn while enhancing the experience of your most valuable clients. This approach ensures that resources are allocated efficiently based on customer value.
Example: Provide tiered customer support based on RFM scores.
Bronze: Access to online knowledge base and email support
Silver: Priority email support and monthly check-in calls
Gold: Dedicated account manager and quarterly business reviews
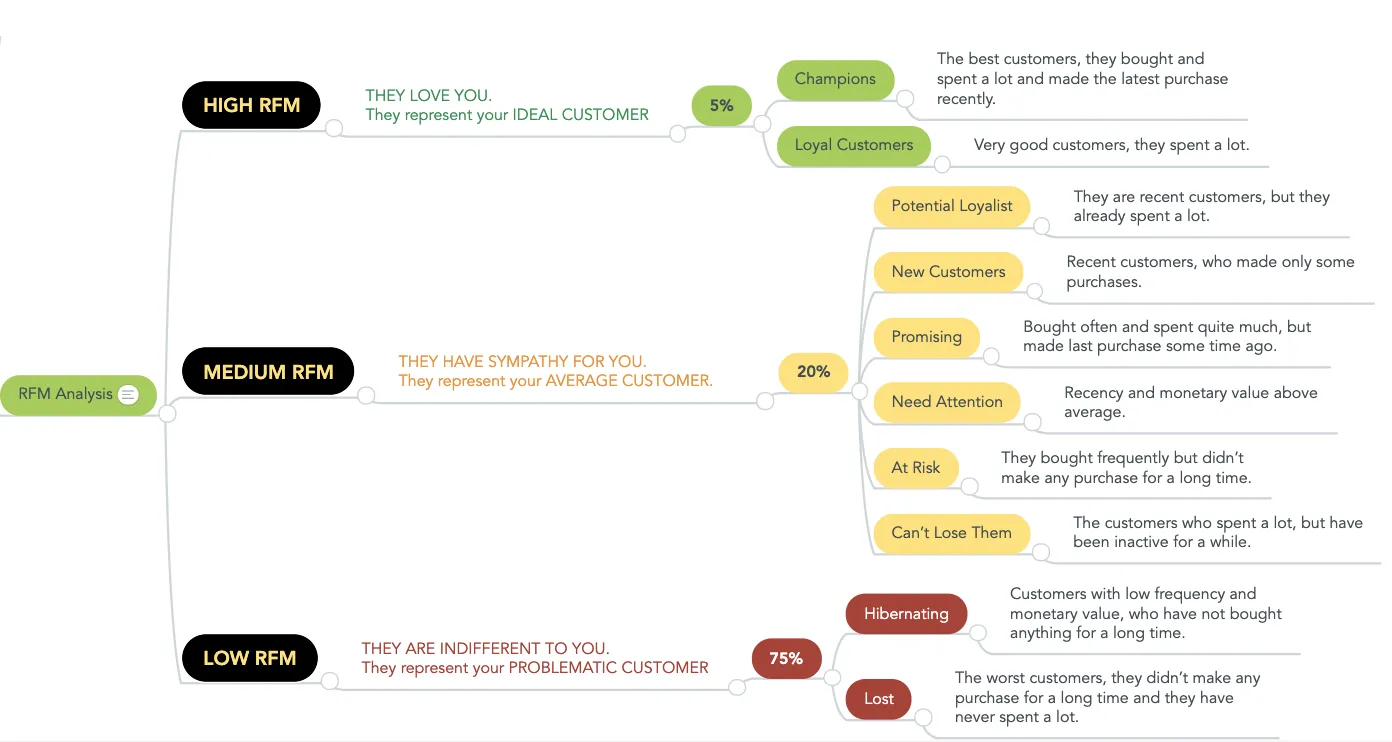
At the end I want to share an amazing RFM analysis from Formaloo that can inspire you to begin working on such analysis.
As we conclude this guide on RFM (Recency, Frequency, Monetary) analysis, it’s crucial to remember that the true value of this analytical tool lies not in the data itself, but in the actions you take based on your insights.
Start small, test your approaches, and iteratively refine your strategies.