


Cohort Analysis Gone Wrong
Common mistakes in interpreting retention data and how to avoid them.

Cohort analysis is a powerful tool providing deep insights into user behavior and retention. Yet, many startups and businesses struggle with interpreting retention data correctly, often leading to misguided strategies and wasted resources.
This article will explore common pitfalls in cohort analysis, provide actionable strategies to avoid them, and offer real-life insights to help you leverage retention data effectively.
The Importance of Cohort Analysis
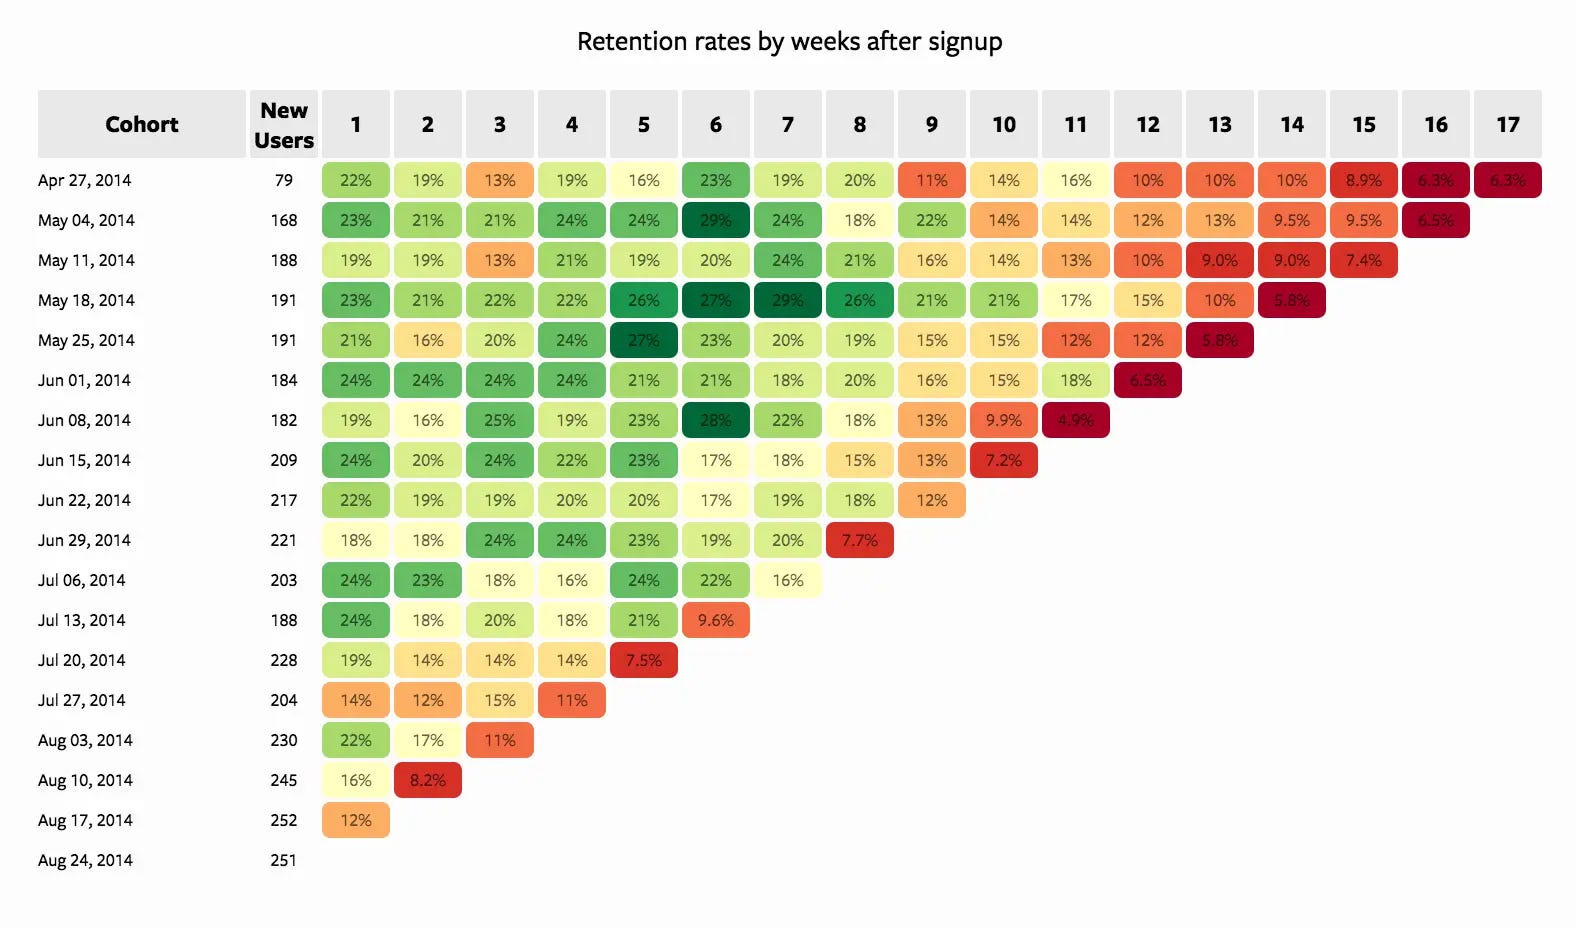
Before diving into common mistakes, it’s crucial to understand why cohort analysis is essential. Businesses can track how these groups perform over time by segmenting users into groups based on shared characteristics or experiences. This analysis reveals trends in user engagement, churn rates, and the overall effectiveness of products or features.
For instance, a SaaS company may analyze users who signed up during a specific marketing campaign to see if they retain better than users who signed up through organic search. Such insights can inform marketing strategies, product development, and customer success efforts.
Common Pitfalls in Interpreting Retention Data
Even though cohort analysis offers a wealth of information, improper execution can lead to misleading conclusions. Below are some common pitfalls, along with actionable strategies to avoid them.
1. Ignoring Contextual Factors
Failing to account for external factors - such as seasonal trends or economic shifts - can skew your retention data, leading to incorrect conclusions.
For example, a holiday season can impact user behavior, drastically affecting retention figures.
Actionable Strategy: Always contextualize your data. When analyzing retention rates, consider external factors influencing user behavior during that period.
• SWOT Analysis: Conduct a SWOT (Strengths, Weaknesses, Opportunities, Threats) analysis to frame your data within a broader context.
• Industry Trends: Monitor industry trends and competitor behavior during the same period for better insight.
Example: If retention dropped in March, examine whether a major event or economic change occurred that could explain the dip. Context matters.
2. Overlooking Sample Size and Statistical Significance
Small sample sizes often lead to unreliable conclusions. Analyzing a cohort with only a few users can show erratic retention patterns that don’t reflect your broader user base.
Actionable Strategy: Ensure your cohorts are large enough to generate meaningful insights. Use statistical tests to determine if observed differences in retention rates are statistically significant.
• Tools: Use statistical software or programming languages like R or Python (e.g., SciPy) to perform significance testing.
• Guidelines: Aim for a minimum of 30 users per cohort to ensure statistical reliability.
Example: A 50% retention rate in a cohort of 10 users may not be significant. However, a 40% retention rate in a cohort of 300 users is likely to reveal a more reliable trend.
3. Focusing Solely on Retention Rates
Retention rates are important, but they don’t give the full picture. High retention can mask other critical issues, such as low user satisfaction or low feature usage.
Actionable Strategy: Complement retention analysis with additional metrics such as user engagement, Net Promoter Score (NPS), and customer lifetime value (CLV).
• Engagement Metrics: Track daily active users (DAU), session length, and feature usage frequency.
• Customer Feedback: Collect qualitative feedback through surveys and user interviews.
Example: A high retention rate may suggest that users are staying, but if they’re not engaging with core features, your product might still require improvement. Dig deeper into engagement metrics.
Actionable Strategies for Effective Cohort Analysis
1. Start with Time-Based Cohorts, Then Dig Deeper
Begin with simple time-based cohorts to establish a baseline, then progressively add complexity.
Action Steps:
Group users by signup date (e.g., weekly or monthly cohorts).
Track key metrics like retention and revenue for each cohort over time.
Identify trends or anomalies in specific cohorts.
Once comfortable, create behavior-based sub-cohorts within your time-based groups.
Example: A mobile app company noticed their March cohort had unusually high retention. Further investigation revealed a successful marketing campaign that attracted particularly engaged users. They now analyze all major marketing initiatives as separate cohorts.
2. Focus on One Key Metric at a Time
Instead of trying to analyze everything at once, choose a single important metric and dive deep.
Action Steps:
Select a metric crucial to your business (e.g., 30-day retention, average revenue per user).
Analyze how this metric varies across different cohorts.
Investigate factors that might influence this metric for high-performing cohorts.
Develop and test hypotheses to improve this metric for underperforming cohorts.
Example: An e-commerce platform focused on improving 90-day customer retention. They discovered that customers who made a second purchase within 30 days of their first had 3x higher 90-day retention. This led to a successful email campaign encouraging early repeat purchases.
3. Implement Simple Predictive Indicators
Use early behavior to predict long-term outcomes without complex models.
Action Steps:
Identify actions that correlate with long-term retention or value.
Track the percentage of users in each cohort who complete these actions.
Use these early indicators to flag at-risk or high-potential users.
Design interventions to encourage beneficial early behaviors.
Example: A SaaS company found that users who logged in at least 5 times in their first week were 4x more likely to become long-term customers. They revised their onboarding process to encourage more frequent early logins, improving overall retention.
4. Combine Cohort Analysis with A/B Testing
Use cohort analysis to enhance your A/B tests and vice versa.
Action Steps:
When running A/B tests, analyze the results by cohort to uncover hidden insights.
Use cohort analysis findings to inform new A/B test hypotheses.
Compare how different cohorts respond to the same A/B test.
Example: A streaming service A/B tested a new recommendation algorithm. While overall engagement increased slightly, cohort analysis revealed that the new algorithm significantly boosted engagement for recent signups but slightly decreased it for long-time users. This led to a tailored approach for different user segments.
5. Create a "Cohort Health Dashboard"
Develop a simple, actionable dashboard to monitor cohort performance regularly.
Action Steps:
Identify 3-5 key metrics that indicate cohort health (e.g., retention, engagement, revenue).
Create a visual dashboard showing these metrics for recent cohorts.
Set up automated alerts for significant changes or when metrics fall below certain thresholds.
Review this dashboard in regular team meetings to guide priorities.
Example: A mobile game studio created a dashboard tracking 7-day retention, average playtime, and in-app purchases for each weekly cohort. When they saw these metrics drop for new cohorts after a recent update, they quickly identified and fixed a bug in the new user tutorial.
6. Analyze Cohort Progression Through Product Milestones
Track how different cohorts move through key stages of your product lifecycle.
Action Steps:
Define 4-6 critical milestones in your user journey (e.g., account creation, first purchase, feature adoption).
Measure the percentage of each cohort that reaches each milestone, and how long it takes.
Identify drop-off points where cohorts lose steam.
Develop strategies to help more users reach the next milestone.
Example: A project management tool mapped milestones from signup to project creation, inviting team members, and using advanced features. They found that cohorts who reached the "inviting team members" stage within 3 days had 2x higher long-term retention. This led to new onboarding flows emphasizing team collaboration features early on.
Cohort analysis is a valuable tool for understanding user retention and behavior, but it’s essential to avoid common pitfalls. By accounting for contextual factors, ensuring adequate sample sizes, and looking beyond retention rates alone, you can make more informed decisions.
Define clear objectives, segment thoughtfully, visualize your data effectively, and adopt an iterative approach to stay agile in a fast-changing environment.